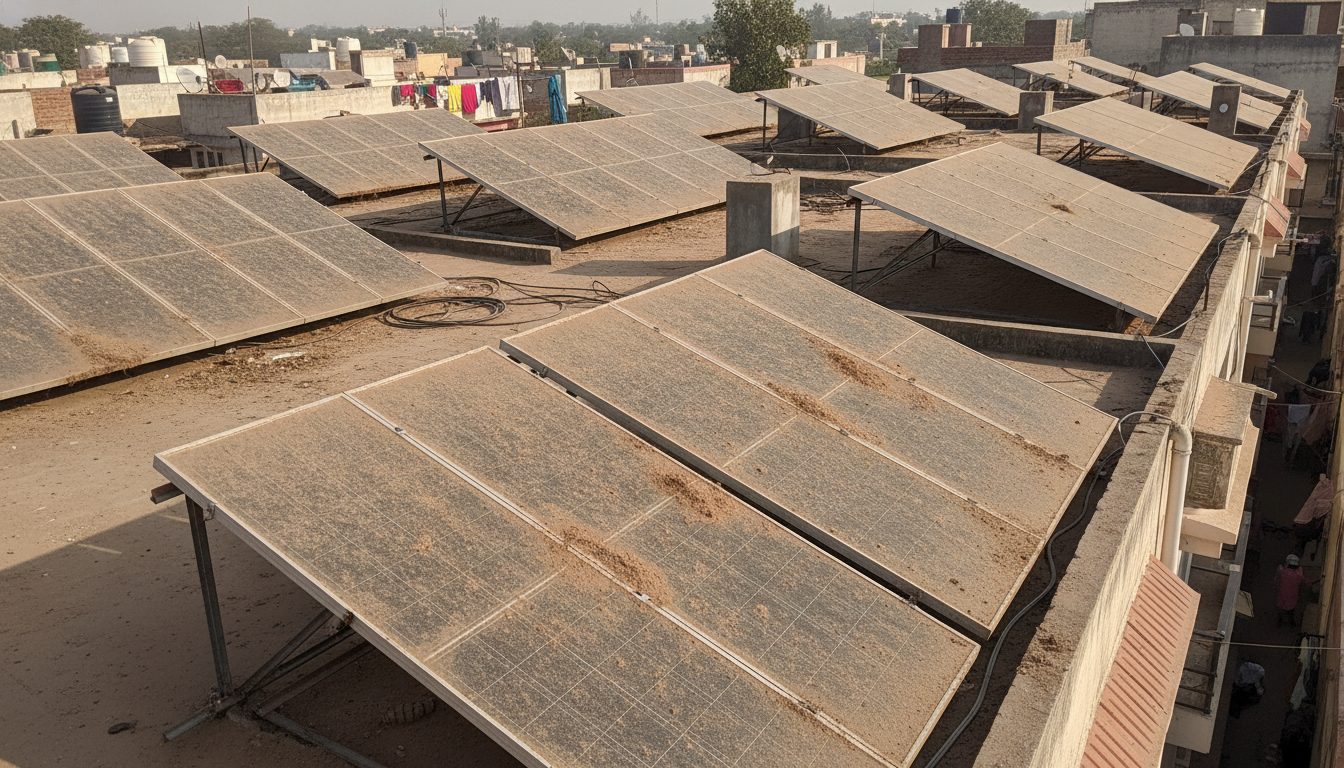
Understanding Dust and Particulate Soiling in India
Dust and particulate matter accumulation can reduce photovoltaic yield by up to 25 percent in dusty agricultural belts and urban industrial zones. When airborne particles settle on glass surfaces, they block sunlight from reaching the solar cells inside the module. This layer of dirt lowers overall electricity generation. Homeowners can use a solar ROI and payback period calculator to understand how decreased generation affects their financial returns over time.
Different regions face unique environmental challenges. The severity of soiling depends on local weather patterns, proximity to highways, construction activity, and local agricultural practices. Without regular cleaning, the gradual drop in output accumulates month after month.
To check the numbers for your own home, try the solar calculator — enter your electricity bill and get system size, subsidy and payback in seconds.
Regional Soiling Factors Across India
North India experiences heavy dust storms during the dry summer months, alongside high particulate matter levels in urban areas. This combination creates a thick layer of grime on rooftop installations. Western India, particularly arid and semi-arid zones, deals with constant windblown sand and desert dust. The dry climate means natural rain does not occur frequently enough to wash the panels clean.
South India experiences different conditions, featuring humid coastal environments mixed with agricultural dust. Humidity causes airborne dust to stick firmly to the glass surface rather than blowing away in the wind. Industrial clusters spread across all these zones add soot and chemical residues to the mix, creating a stubborn film that requires physical removal.
Calculating Generation Losses and Financial Impact
Quantifying energy loss helps determine whether cleaning interventions make financial sense. If a residential or commercial system loses up to 25 percent of its potential output during peak dry spells, the financial loss shows up directly on monthly electricity bills. Facility managers can pair consumption data with a solar bill simulator and tariff calculator to track how generation dips translate to higher grid electricity purchases.
To calculate losses accurately, monitor generation data on inverter displays or mobile monitoring apps against expected output baselines. Compare the cost of lost electricity units against the expense of labor or cleaning services before deciding on a schedule.
Manual Washing Versus Automated Maintenance
Choosing between manual labor and automated systems depends on plant size, water availability, and labor costs. Small residential rooftops usually rely on manual washing using a soft brush and clean water. This method works well for systems with easy terrace access, provided someone monitors the cleaning frequency during dusty months.
Commercial and industrial facilities often install automated cleaning systems, such as water-free robotic brushes or fixed sprinkler networks, because manual cleaning of large arrays is time-consuming and expensive. Facility managers should evaluate capital expenses for automation against recurring manual labor costs to protect long-term system profitability.
🌟 Ready to Go Solar? Get 3 Free Quotes
Connect with verified, MNRE-empanelled solar installers near you — free, no obligation.
Get Free Solar Quotes →