The Limitations of Traditional Manual Site Surveys
Traditional manual site surveys often miss surrounding obstacles, leading to generation losses from localized shading. When installers rely on tape measures and visual checks on Indian rooftops, they frequently overlook distant trees, overhead power lines, or adjacent building extensions that cast shadows during specific hours. These missed obstructions result in faulty system designs and lower-than-expected power output.
Property owners planning a transition can verify space constraints using a solar roof area calculator before requesting advanced aerial assessments. Accurate initial planning prevents costly redesigns once installation begins on site.
Not sure what size you need? Our free solar calculator works out system size, cost after subsidy and payback from your monthly electricity bill.
How Drones, LiDAR, and Photogrammetry Create 3D Models
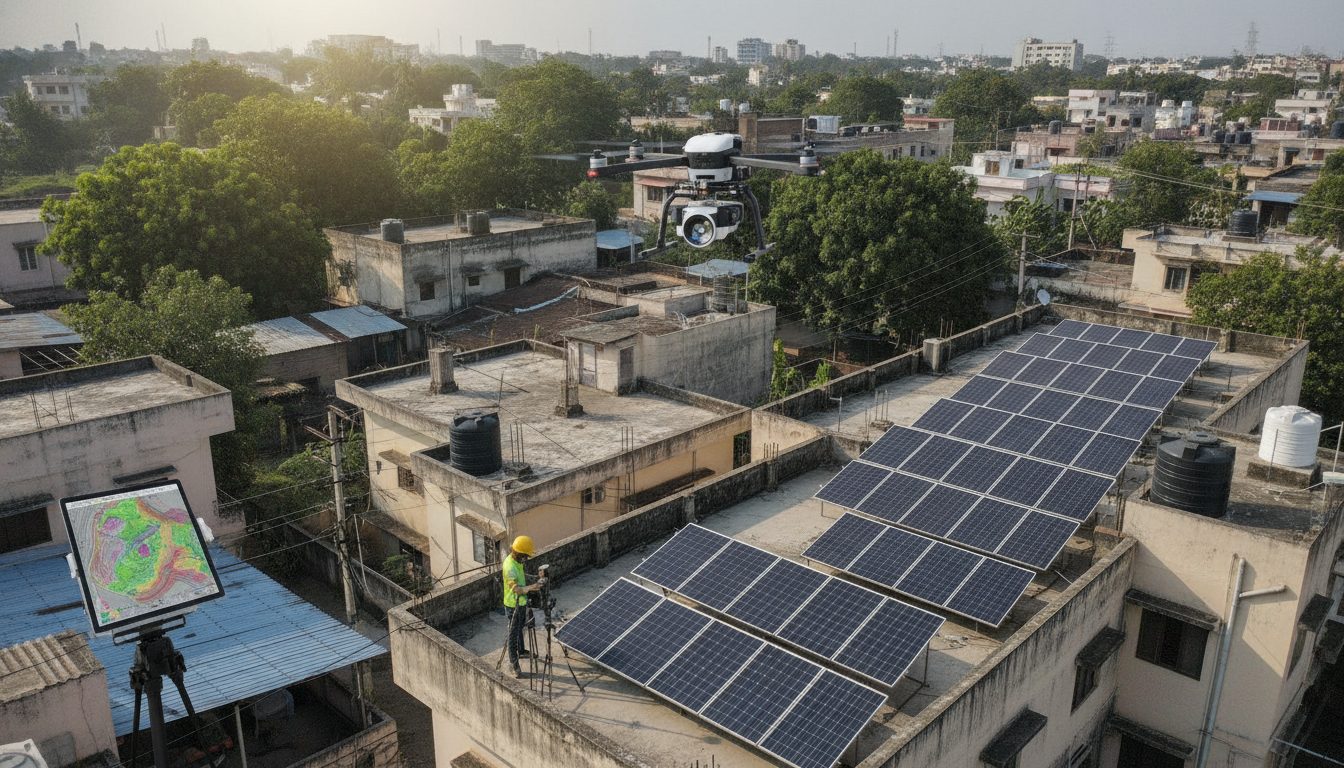
Commercial EPCs deploy drones with LiDAR and photogrammetry software to generate 3D rooftop models. LiDAR sensors emit laser pulses to measure exact distances and surface elevations, while high-resolution cameras capture overlapping aerial images. Specialized processing software combines these data streams to reconstruct the entire property in three dimensions.
This technology captures every chimney, parapet wall, and rooftop HVAC unit with millimeter precision. The resulting digital twin reflects exact tilt angles and spatial dimensions, removing human error from the site assessment phase entirely.
Benefits of Accurate Shading Profiles for System Design
Detailed shadow analysis enables precise string inverter layout and cable run optimization. Because the design team knows exactly how shadows move across the roof throughout different seasons, they can group panels into optimal strings to minimize voltage mismatches.
Furthermore, these precise shadow profiles feed directly into bankable energy yield reports. Financial institutions and lenders rely on these verified generation forecasts to approve solar loans and commercial project funding without dispute.
🌟 Ready to Go Solar? Get 3 Free Quotes
Connect with verified, MNRE-empanelled solar installers near you — free, no obligation.
Get Free Solar Quotes →