 SolarCalculators
Solar Panel Degradation Types & Warranty Claims: PID, LID & LeTID Explained (2026 Guide)
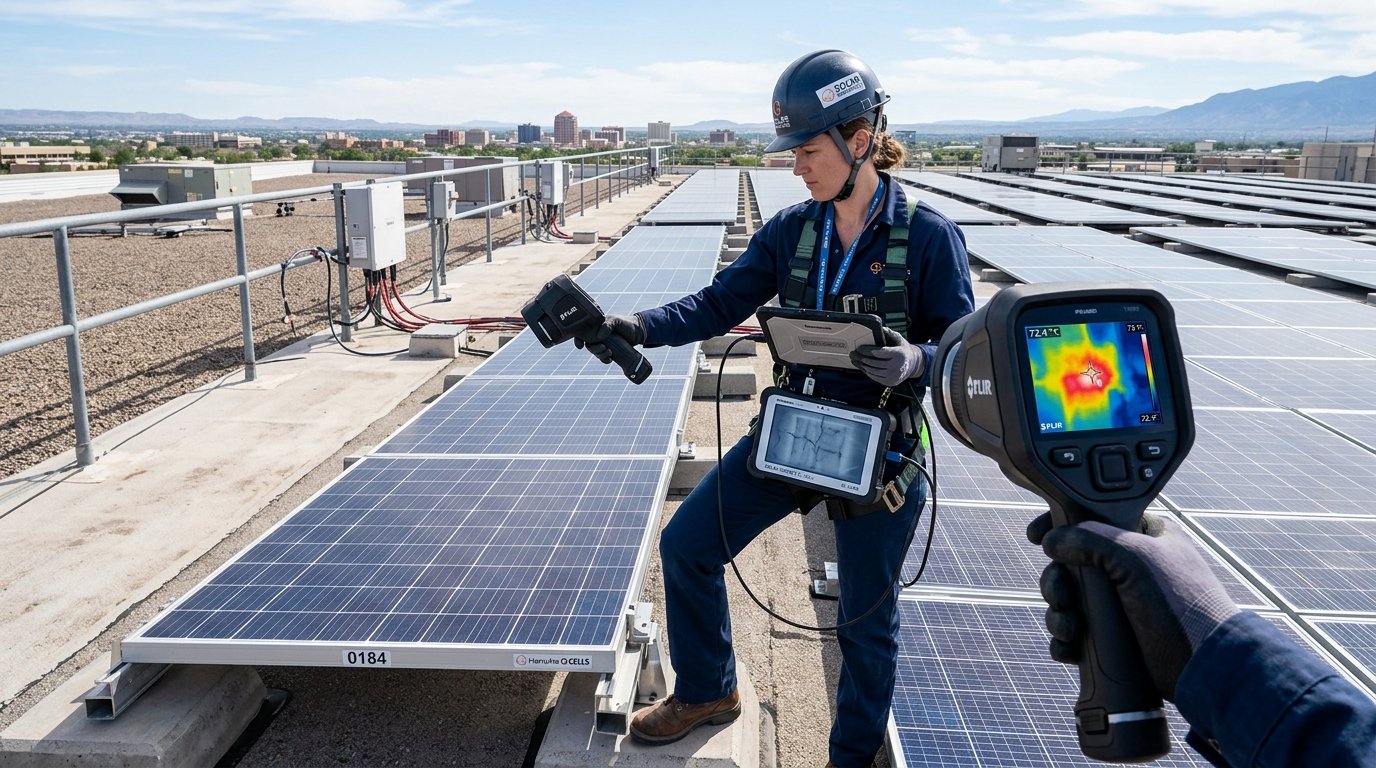
🔬 Understanding Solar Cell Degradation: While all Tier-1 solar panel manufacturers guarantee 80% to 87.5% power output after 25 to 30 years, premature field degradation can slash plant generation by 15% to 40% in just 3 years if severe mechanisms like Potential Induced Degradation (PID) or Light and elevated Temperature-Induced Degradation (LeTID) strike. Understanding the exact scientific failure modes empowers plant owners to identify bad batches through Electroluminescence (EL) imaging and successfully claim manufacturer warranty replacements.
1. The 4 Major Solar Degradation Mechanisms Explained
| Degradation Mode | Scientific Cause | Symptoms in Field | Technology Vulnerability |
|---|---|---|---|
| LID (Light-Induced Degradation) | Boron-Oxygen (B-O) defect complexes forming upon initial sunlight exposure | 1.5% to 2.5% power drop in first 48–72 hours of operation | Standard P-Type Mono PERC (Virtually zero in N-Type TOPCon/HJT) |
| PID (Potential Induced Degradation) | High negative string voltage (up to 1500V) causing sodium ion (Na+) migration through glass into cell PN junction | Severe power loss (up to 40%) in modules closest to negative inverter terminal | Un-grounded systems in high humidity & high temperature climates |
| LeTID (Light & Elevated Temp Degradation) | Hydrogen defect redistribution in cell bulk under high operating temps (>60°C) | Gradual 3% to 8% loss appearing after 12–24 months in Indian summer | P-Type PERC cells with non-optimized dielectric passivation |
| Cell Microcracks & Hot Spots | Mechanical stress, walking on panels, hail, or cracked solder ribbons creating localized high-resistance bottlenecks | Thermal runaway hotspots exceeding 120°C, backsheet burning, bypass diode failure | Poor handling during transport, thin wafer modules without proper cross-ribbons |
2. Field Diagnostic Tools: EL Testing & Thermal Drone Thermography
To establish an undisputable technical claim against panel OEMs, solar asset managers use two standard diagnostic procedures:
- Electroluminescence (EL) Imaging: An external DC current is fed backwards into the panel at night. The panel emits infrared light captured by high-resolution cooled CCD cameras. Broken finger grids, cell busbar microcracks, and dead inactive cell zones appear as distinct dark black cracks.
- Thermal Infrared (IR) Thermography: Handheld radiometric thermal imagers or aerial drones detect localized temperature differentials (ΔT > 10°C indicates a localized cell defect or shunted bypass diode).
3. Step-by-Step Performance Warranty Claim Protocol in India
- Verify Flash Test Data vs Baseline: Compare degraded string Open Circuit Voltage (Voc) and Short Circuit Current (Isc) under calibrated IV curve tracers normalized to STC (1000 W/m², 25°C).
- Document Serial Numbers & Visual Defects: Capture high-resolution photos of module barcode serial stickers, EVA delamination, snail trails, or browning.
- Independent NABL Lab Testing: If OEM disputes field IV curves, send 3 to 5 random sample panels to an accredited testing facility (such as NISE, UL, or TUV Rheinland) for flash testing.
- Formal RMA Submission: Submit Return Material Authorization (RMA) with manufacturer warranty service desk requesting module replacements or financial compensation for degraded kWh yield.
4. Frequently Asked Questions (FAQs)
Q1: Are N-Type TOPCon and HJT solar panels completely immune to PID and LID?
N-Type cells use Phosphorus dopants instead of Boron, eliminating Boron-Oxygen LID completely. With POE (Polyolefin Elastomer) encapsulation, PID resistance exceeds IEC 62804 standard by 4x.
Q2: What is the normal acceptable degradation rate per year?
Tier-1 manufacturers guarantee a maximum 1.0% in Year 1 and 0.40% to 0.55% per year from Year 2 to Year 25, ensuring >85% power retention at year 25.