 SolarCalculators
Solar Panel Snail Trails, Micro-Cracks & EL Testing Guide 2026
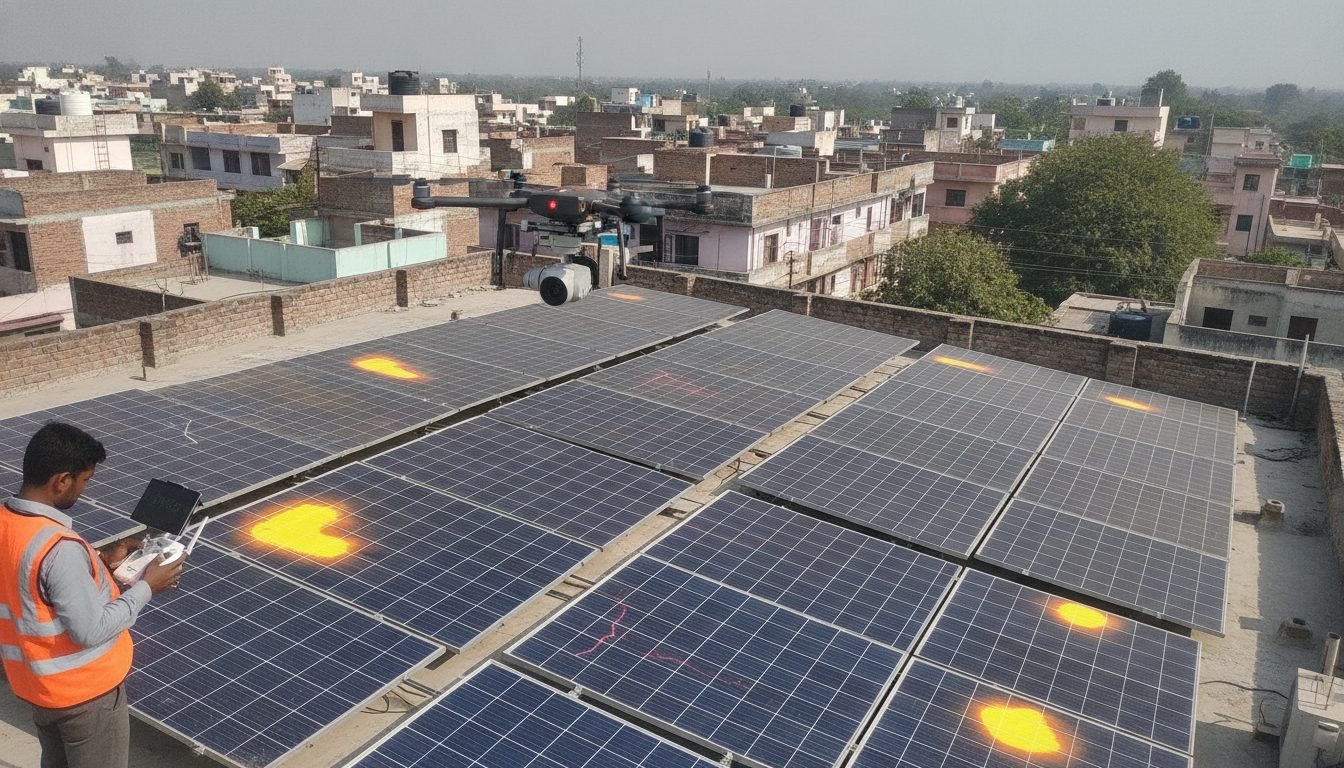
1. The Chemical Genesis of Snail Trails
Snail trails do not originate on the front glass surface; they form entirely inside the encapsulated sandwich between the front EVA (Ethylene Vinyl Acetate) sheet and the silicon wafer:
| Reaction Step | Chemical / Mechanical Process | Microscopic Observable Effect |
|---|---|---|
| 1. Physical Micro-Crack Inception | Transport rough handling, installer stepping on panels during installation, or extreme hailstorms | Invisible mechanical crack fracture across brittle \(160\,\mu\text{m}\) silicon wafer |
| 2. Moisture & Oxygen Ingress | Atmospheric water vapor diffuses through breathable polymeric backsheets (especially Tedlar/PET) | Moisture reaches the cell front along the physical micro-crack pathway |
| 3. EVA Decomposition | UV sunlight + moisture triggers hydrolysis of EVA encapsulant, releasing acetic acid (\(\text{CH}_3\text{COOH}\)) | Acidic micro-environment forms along the crack interface |
| 4. Silver Nanoparticle Synthesis | Acetic acid corrodes the cell's front screen-printed silver (\(\text{Ag}\)) busbars and grid fingers: \[\text{Ag} \rightarrow \text{Ag}^+ \rightarrow \text{Ag nanoparticles (colloidal silver)}\] | Colloidal silver nanoparticles precipitate inside the EVA, creating visible dark grayish-brown discoloration tracks ("snail trails") |
2. Electroluminescence (EL) Testing: The X-Ray of Solar Modules
Human eyes and standard infrared thermal cameras cannot identify early-stage micro-cracks before thermal runaway occurs. Electroluminescence (EL) Testing functions like an X-ray for photovoltaic silicon:
- The Physics of Electroluminescence: In normal operation, solar cells absorb photons and emit electrons. During EL testing, the process is reversed: a DC power supply injects forward-bias electric current (equal to the module's rated \(I_{\text{sc}}\)) into the panel in a pitch-dark room or at night.
- Near-Infrared Photon Emission: Radiative band-to-band recombination of electrons and holes causes healthy crystalline silicon to emit faint near-infrared light at wavelengths between 1,000 nm and 1,200 nm (peak at 1,150 nm).
- InGaAs / Modified CCD Camera Capture: Specialized cooled cameras with IR-pass filters capture this light. Healthy silicon glows bright uniform gray/white, while electrical breaks, inactive cell fragments, and micro-cracks block current flow, appearing as stark black fractures.
3. Defect Classification Criteria Under IEC 61215 / IEC 62446-3
Not every micro-crack warrants discarding a panel. Technical inspection standards categorize cracks into three severity grades:
Class A (Hairline Cracks with Zero Inactive Area): Fine crack line visible on EL, but all cell segments remain electrically connected to busbars. Negligible power degradation (\(< 1.5\%\)). Acceptable for continued operation; monitor annually.
Class B (Partially Inactive Cell Fragments): Crack severs some grid fingers, reducing local current collection by 5% to 15%. Cell fragment appears dark gray. Causes slight mismatch and minor localized heating (\(\Delta T \approx 5^\circ\text{C} - 10^\circ\text{C}\)).
Class C (Complete Inactive Isolation / Cross-Cracks): Severe dendritic cross-cracks sever more than 20% of the cell area completely from all busbars. The disconnected section appears jet-black on EL. Bypassed or reverse-biased cell develops intense hotspots exceeding \(120^\circ\text{C}\), risking backsheet browning and glass fracture. Mandatory warranty replacement.
4. Warranty Claim & Insurance Recovery Protocol
Tier-1 module manufacturers (Waaree, Adani, Tata Power Solar, Jinko, Longi) and insurance underwriters require standardized evidence before honoring power degradation or defect claims:
- Baseline Flash Test vs Degraded I-V Curve: Submit factory baseline flash-test barcode data compared against a calibrated mobile I-V curve tracer showing power loss exceeding the linear warranty threshold (e.g., \(> 2.0\%\) in Year 1 or \(> 0.55\%/\text{year}\) thereafter).
- Matched EL Image and Thermal IR Photo: High-resolution EL image proving that Class C micro-cracks are located at the exact coordinates of thermal hotspots identified via radiometric drone thermography.
- Transportation & Handling Audit: Proof that cracks were not caused by improper post-delivery on-site mishandling (such as technicians walking on modules during installation). Dual-glass modules provide superior mechanical resistance against micro-cracking compared to older single-glass polymeric backsheet modules.